Our approach combines top-down estimates of CH₄ emissions at multiple scales and other ancillary information to assess the spatial, temporal and sectoral distribution of CH₄ emissions across the Southern San Joaquin Valley. This multi-scale framework also provides information on the relative value of information from existing research-grade methods and lower-cost methods, towards supporting the monitoring and mitigation scaling analysis for our community and stakeholder engagement task.
Representational Data
Observations collected at multiple scales using our tiered-approach framework can be visualized using tools such as GoogleEarth maps (ground and airborne platforms), time series (fixed towers), and point surveys (residential building). This multiscale visualization allows us to pinpoint methane hotspots and distinguish between biogenic and fossil sources.
GETBUS SURVEY DATA
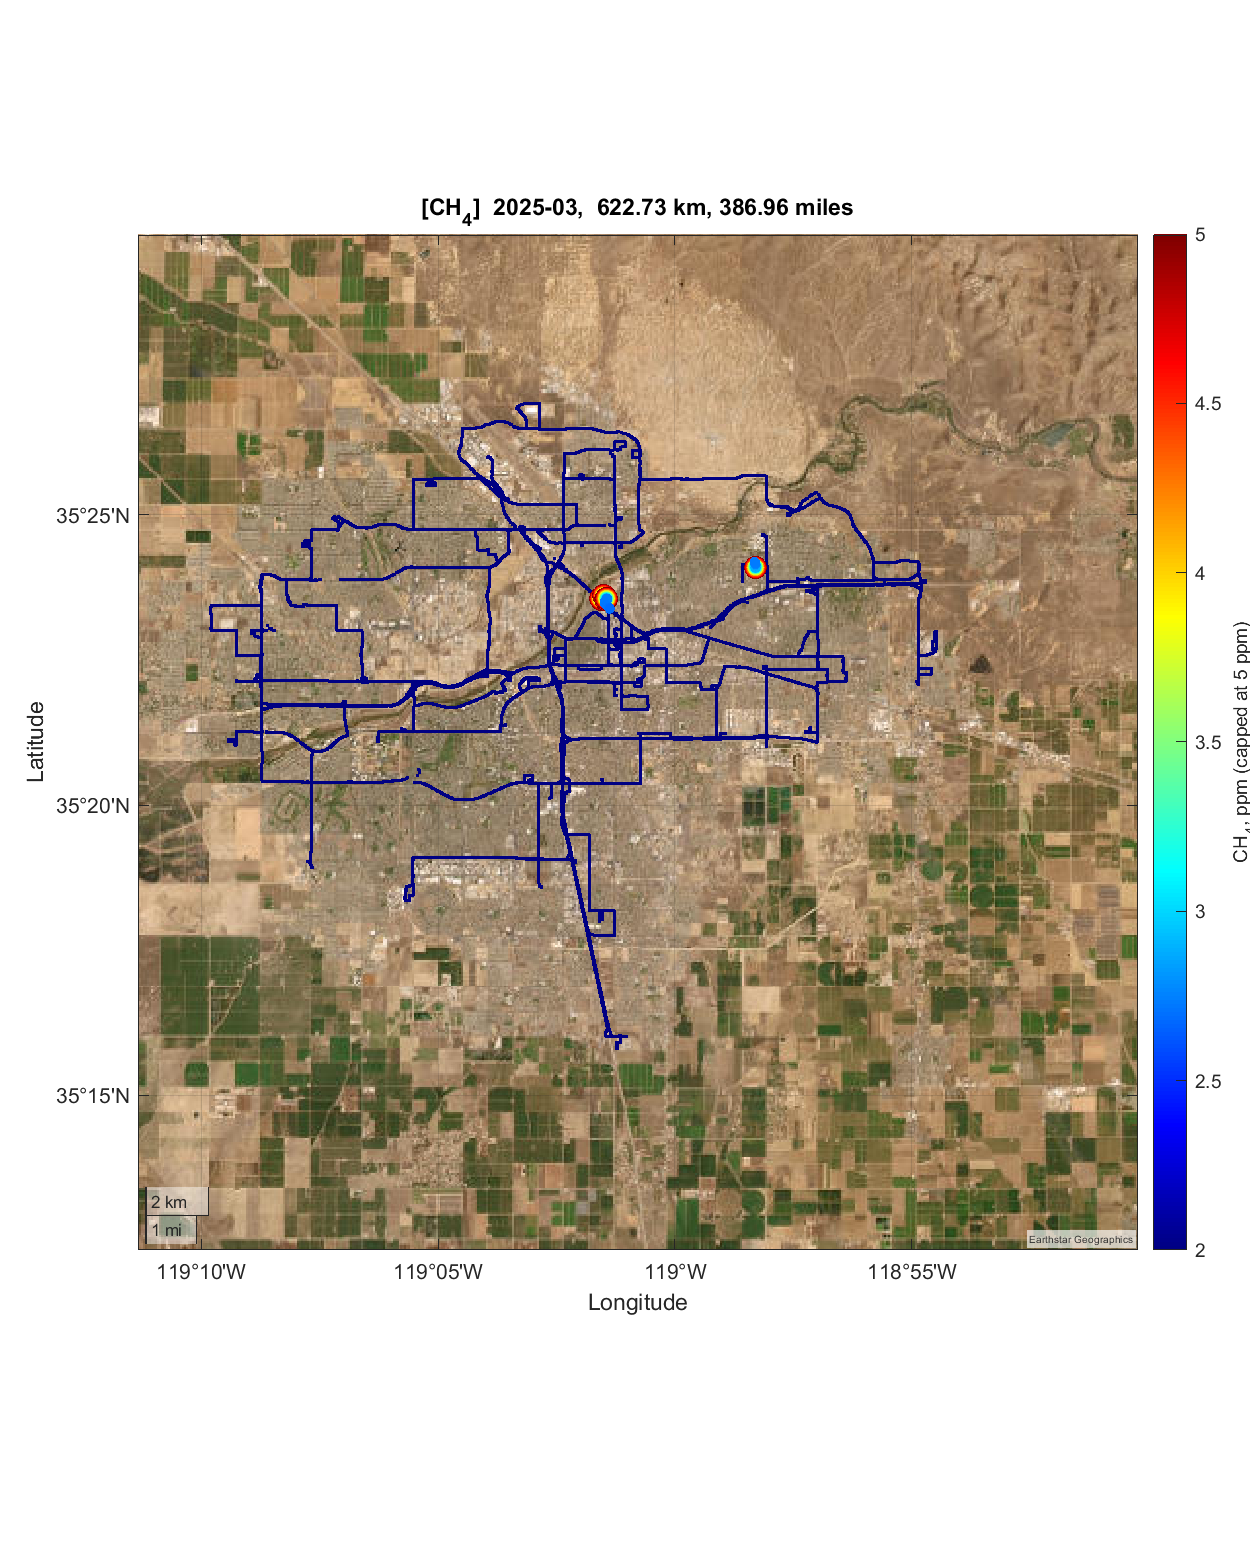
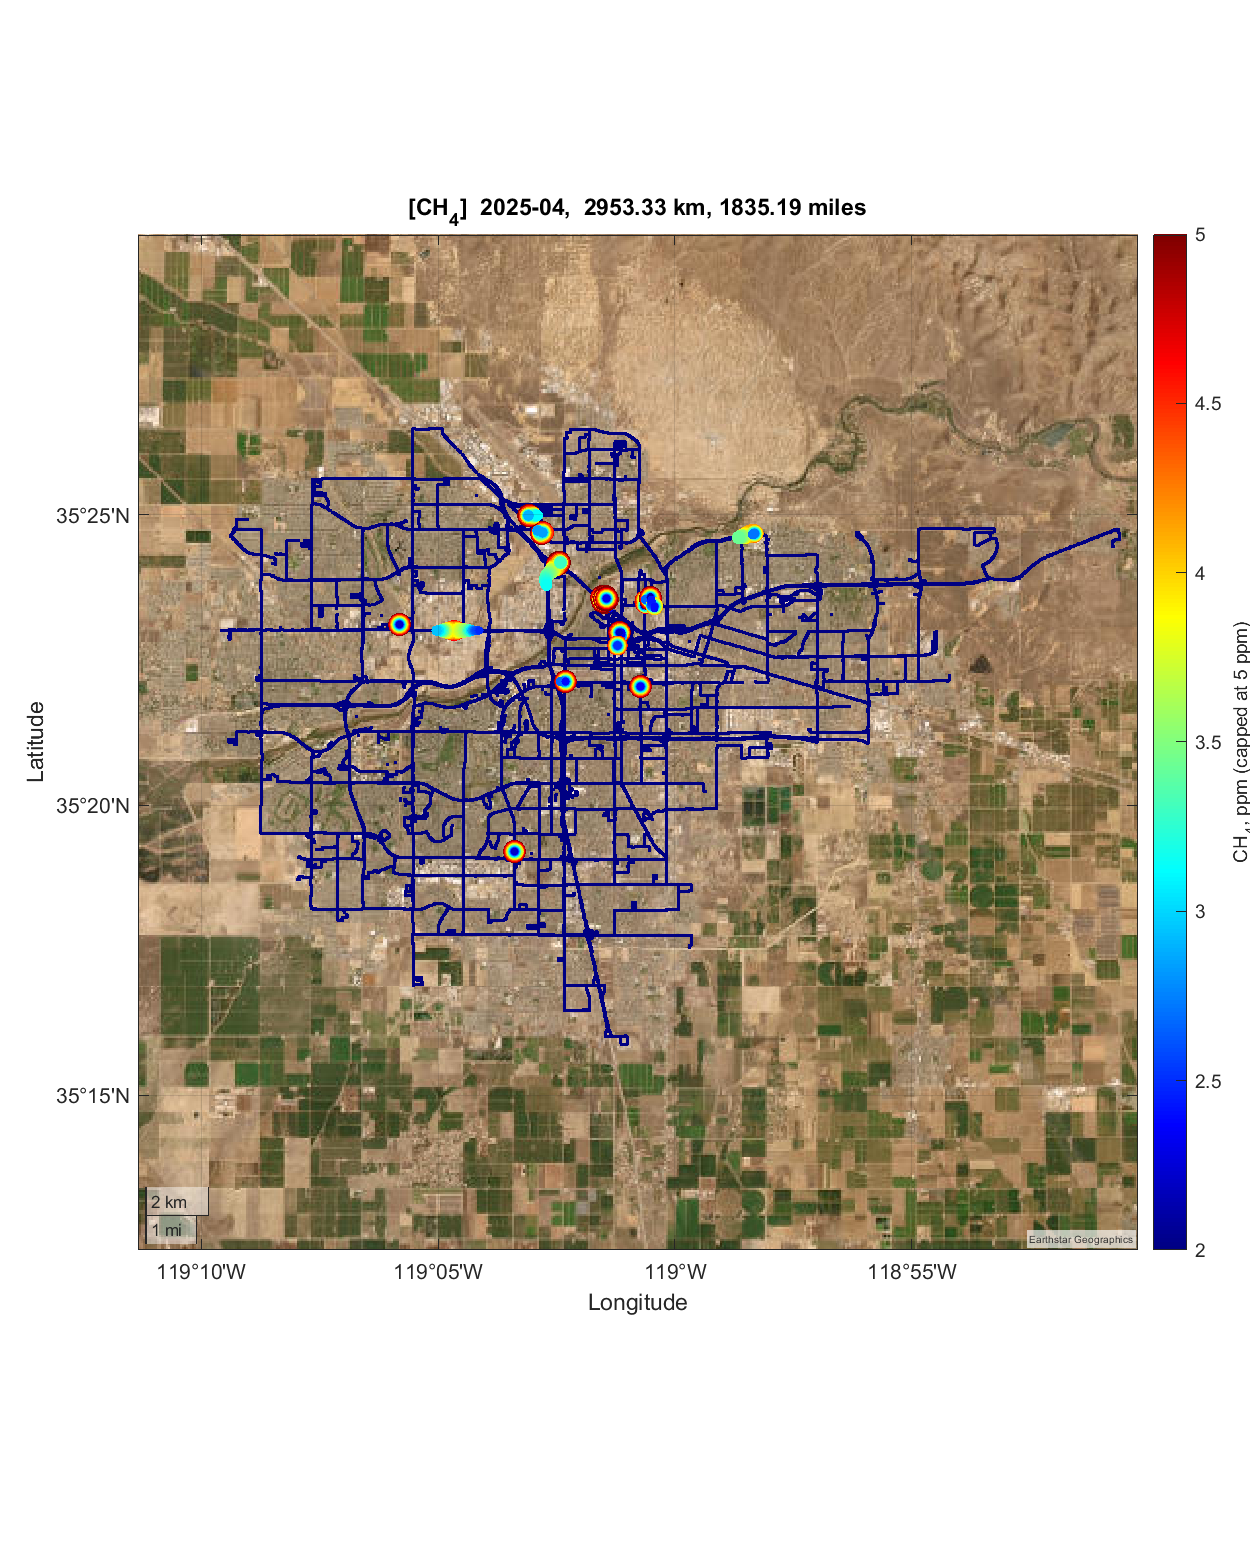
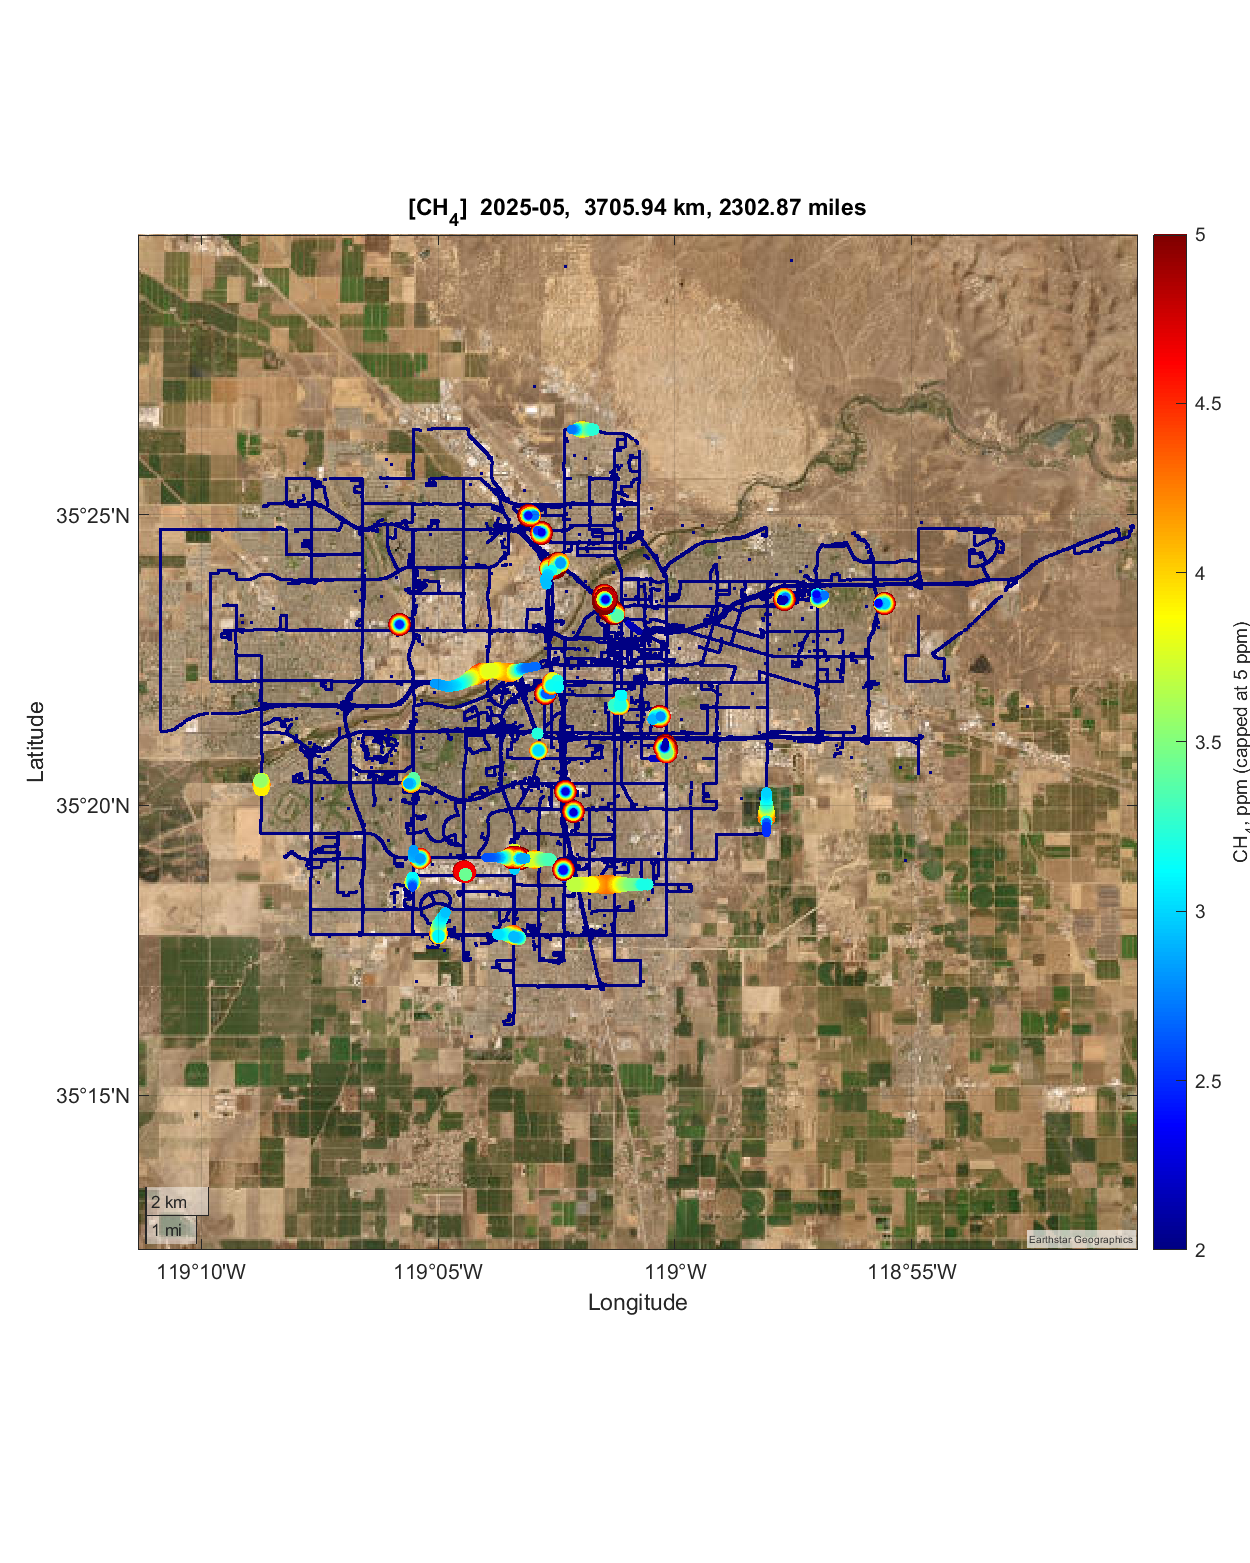
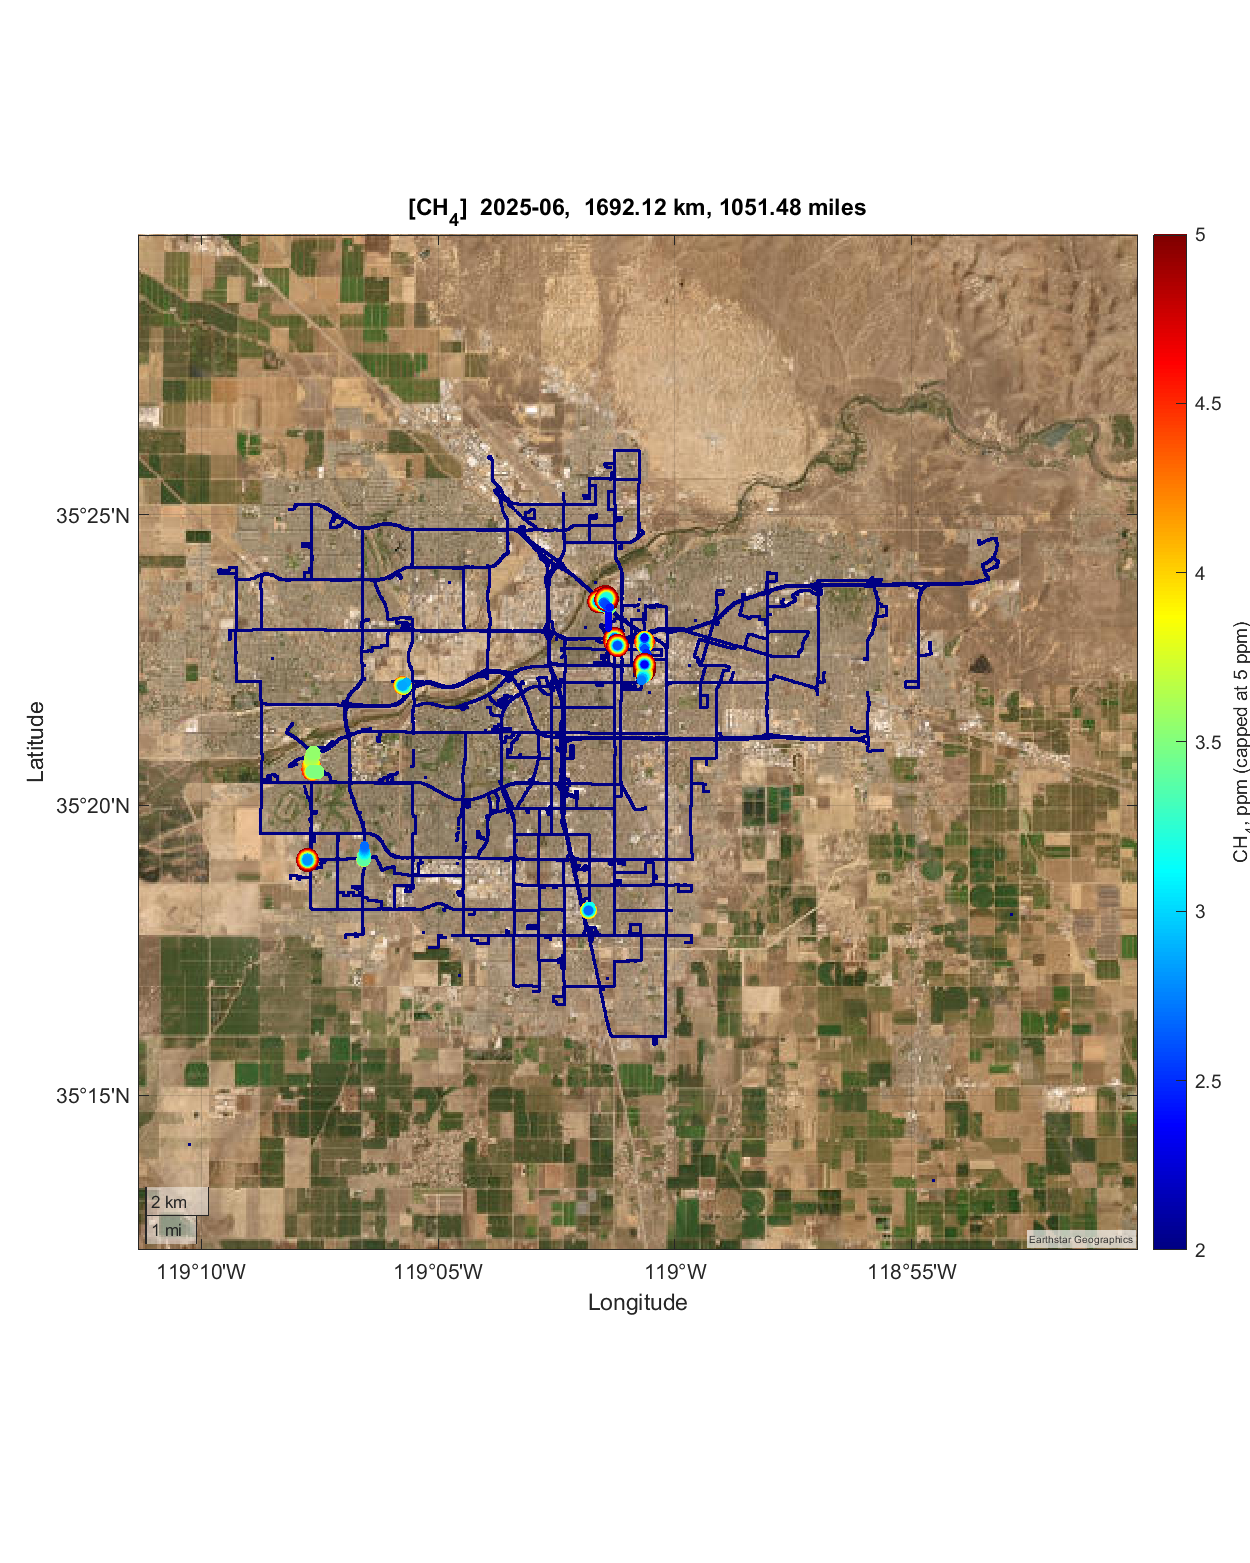
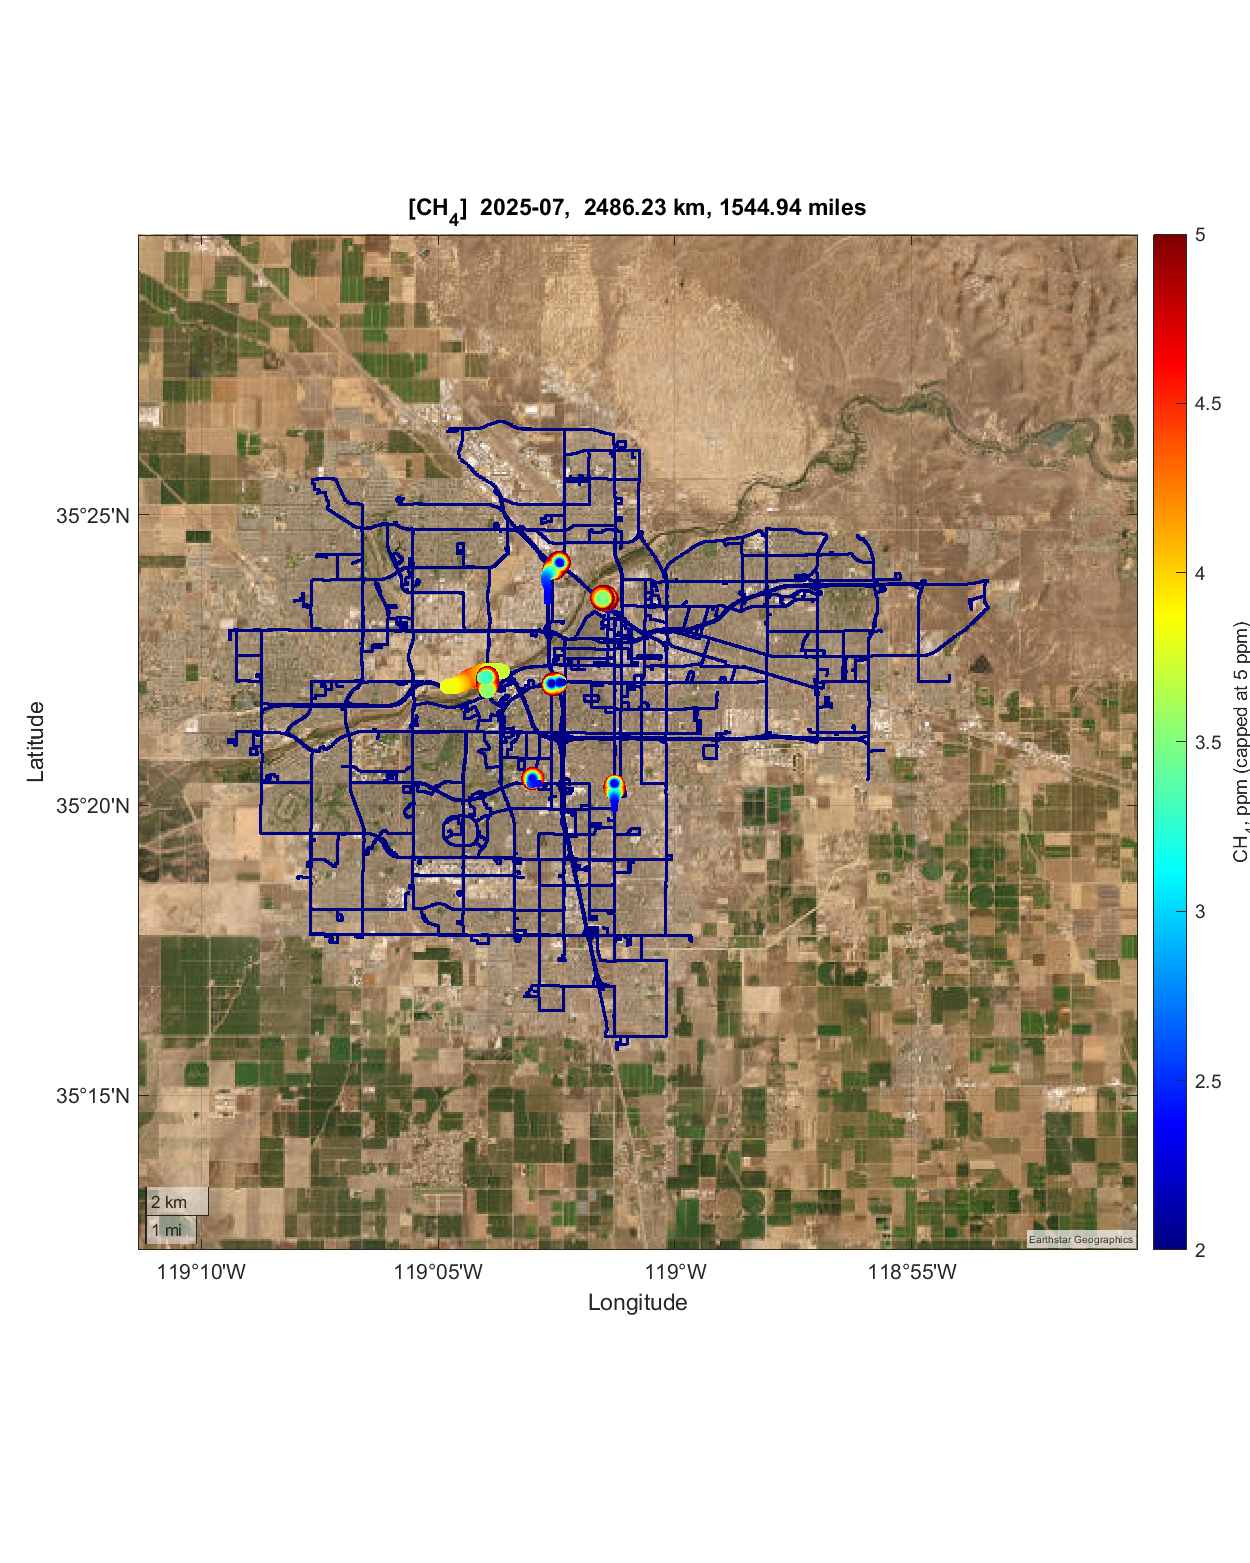
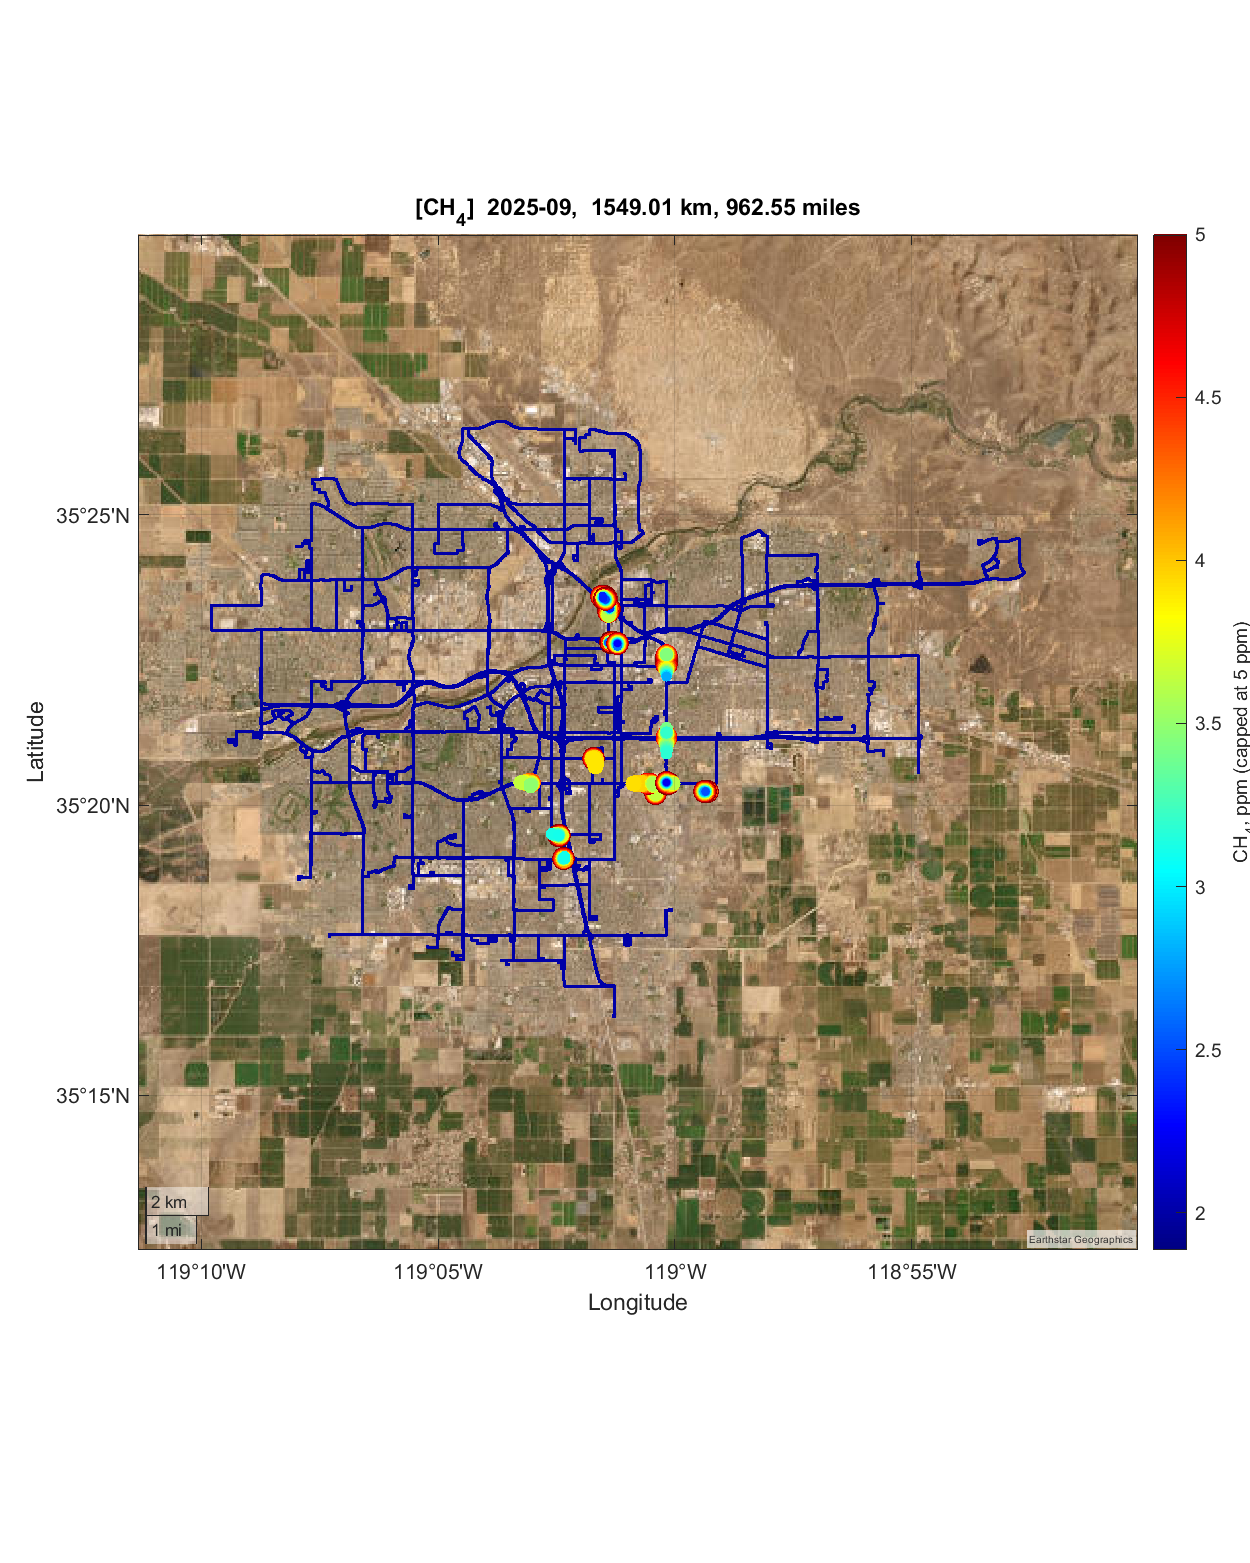
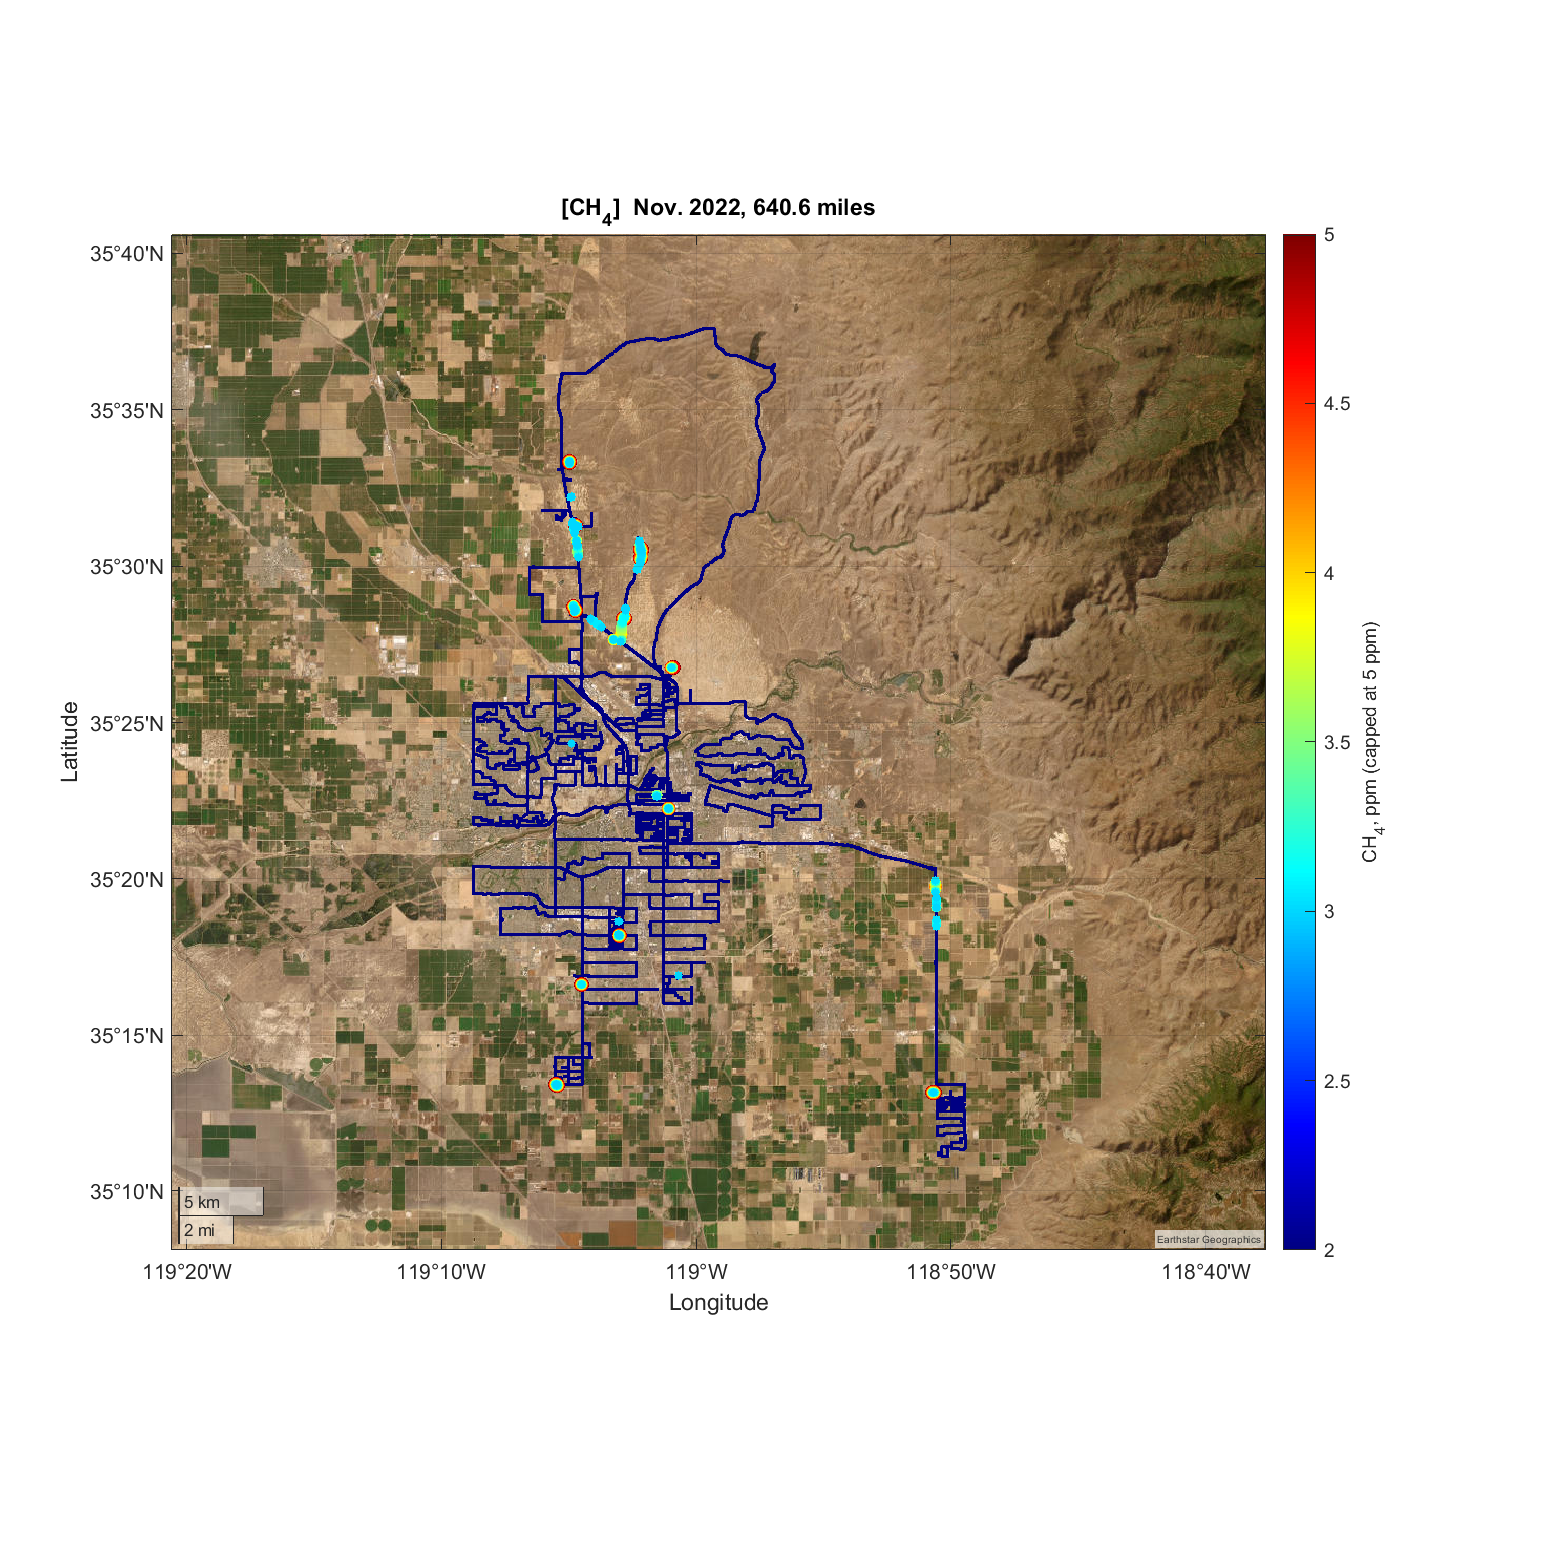
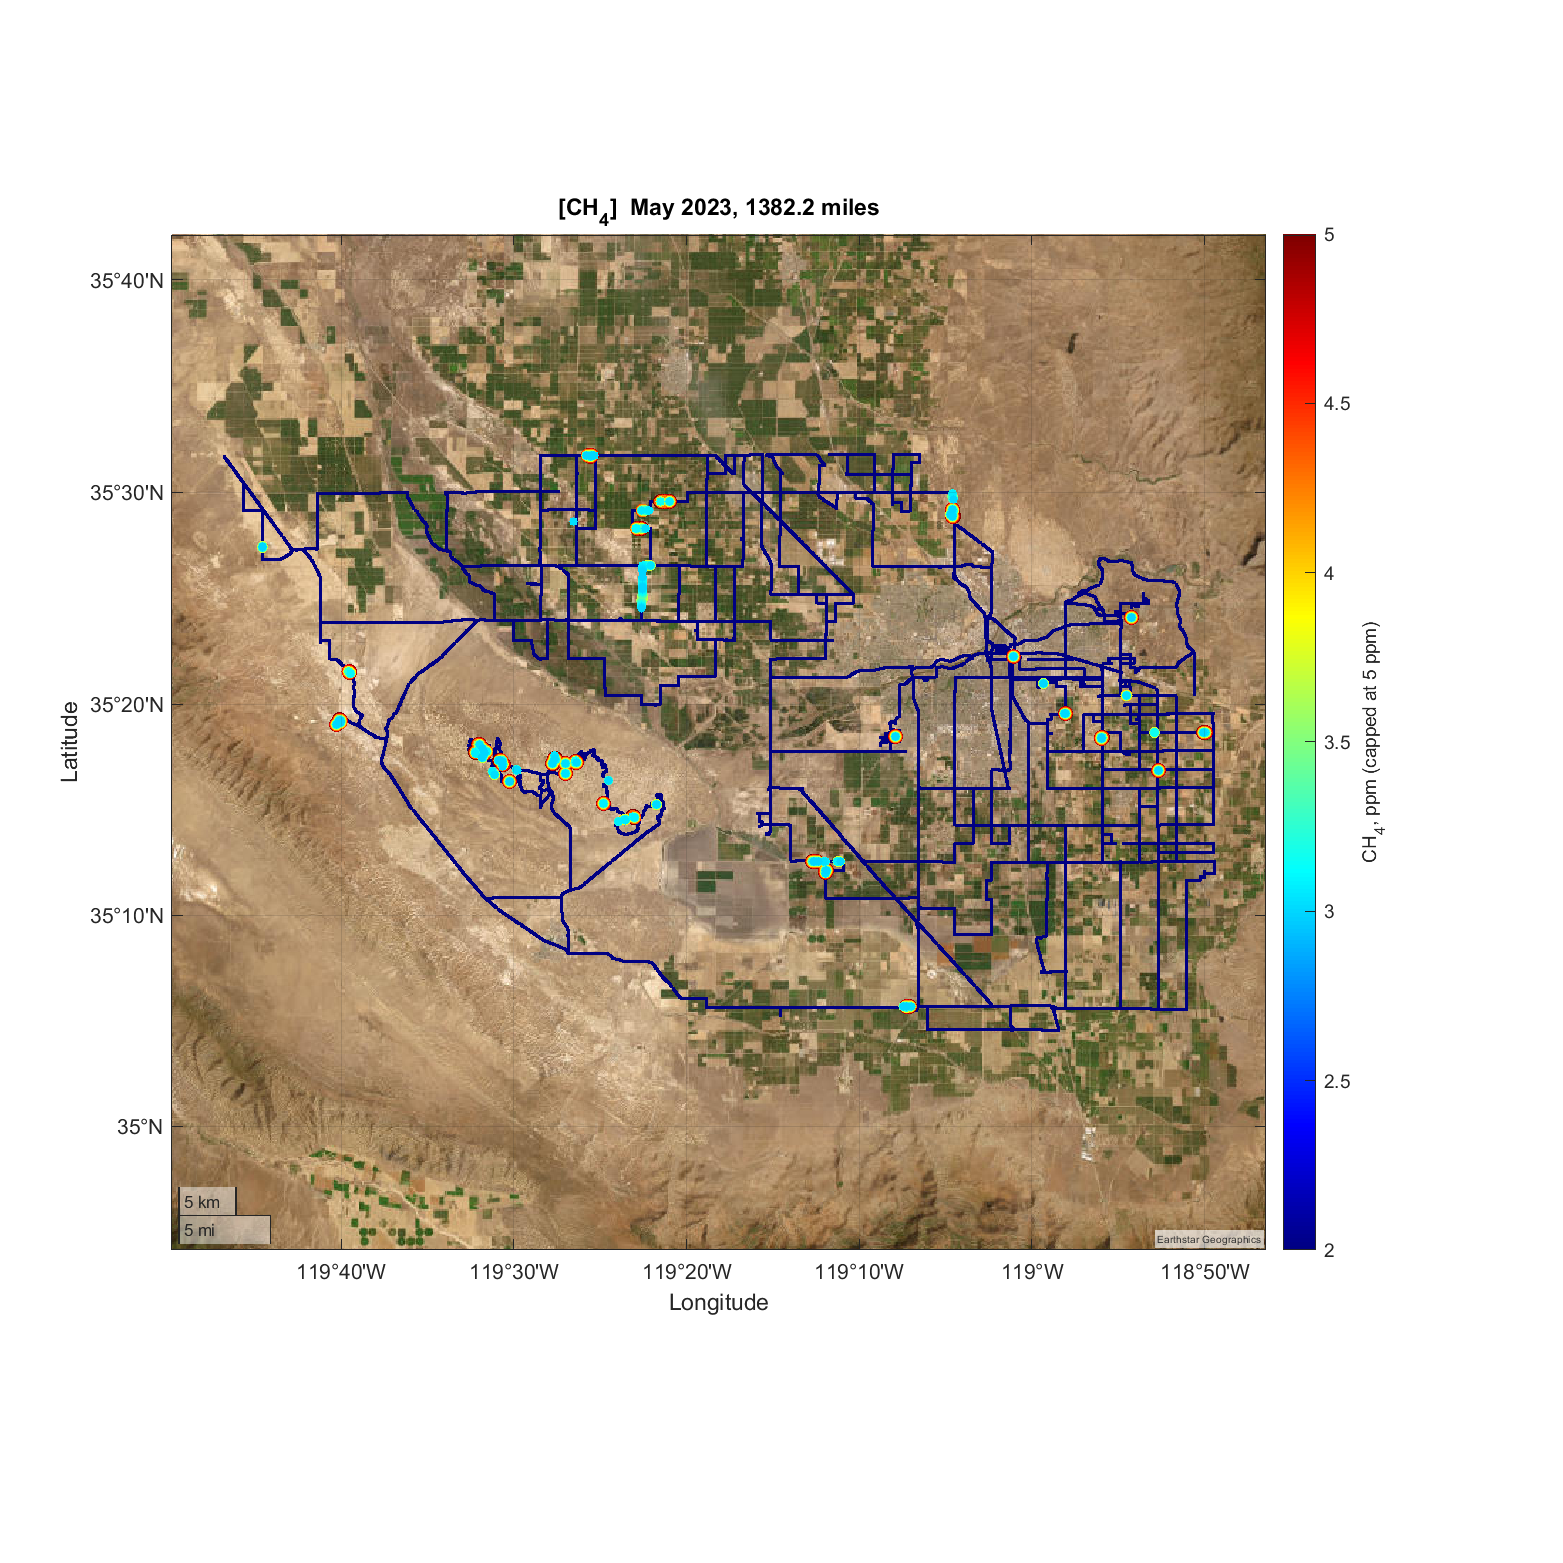
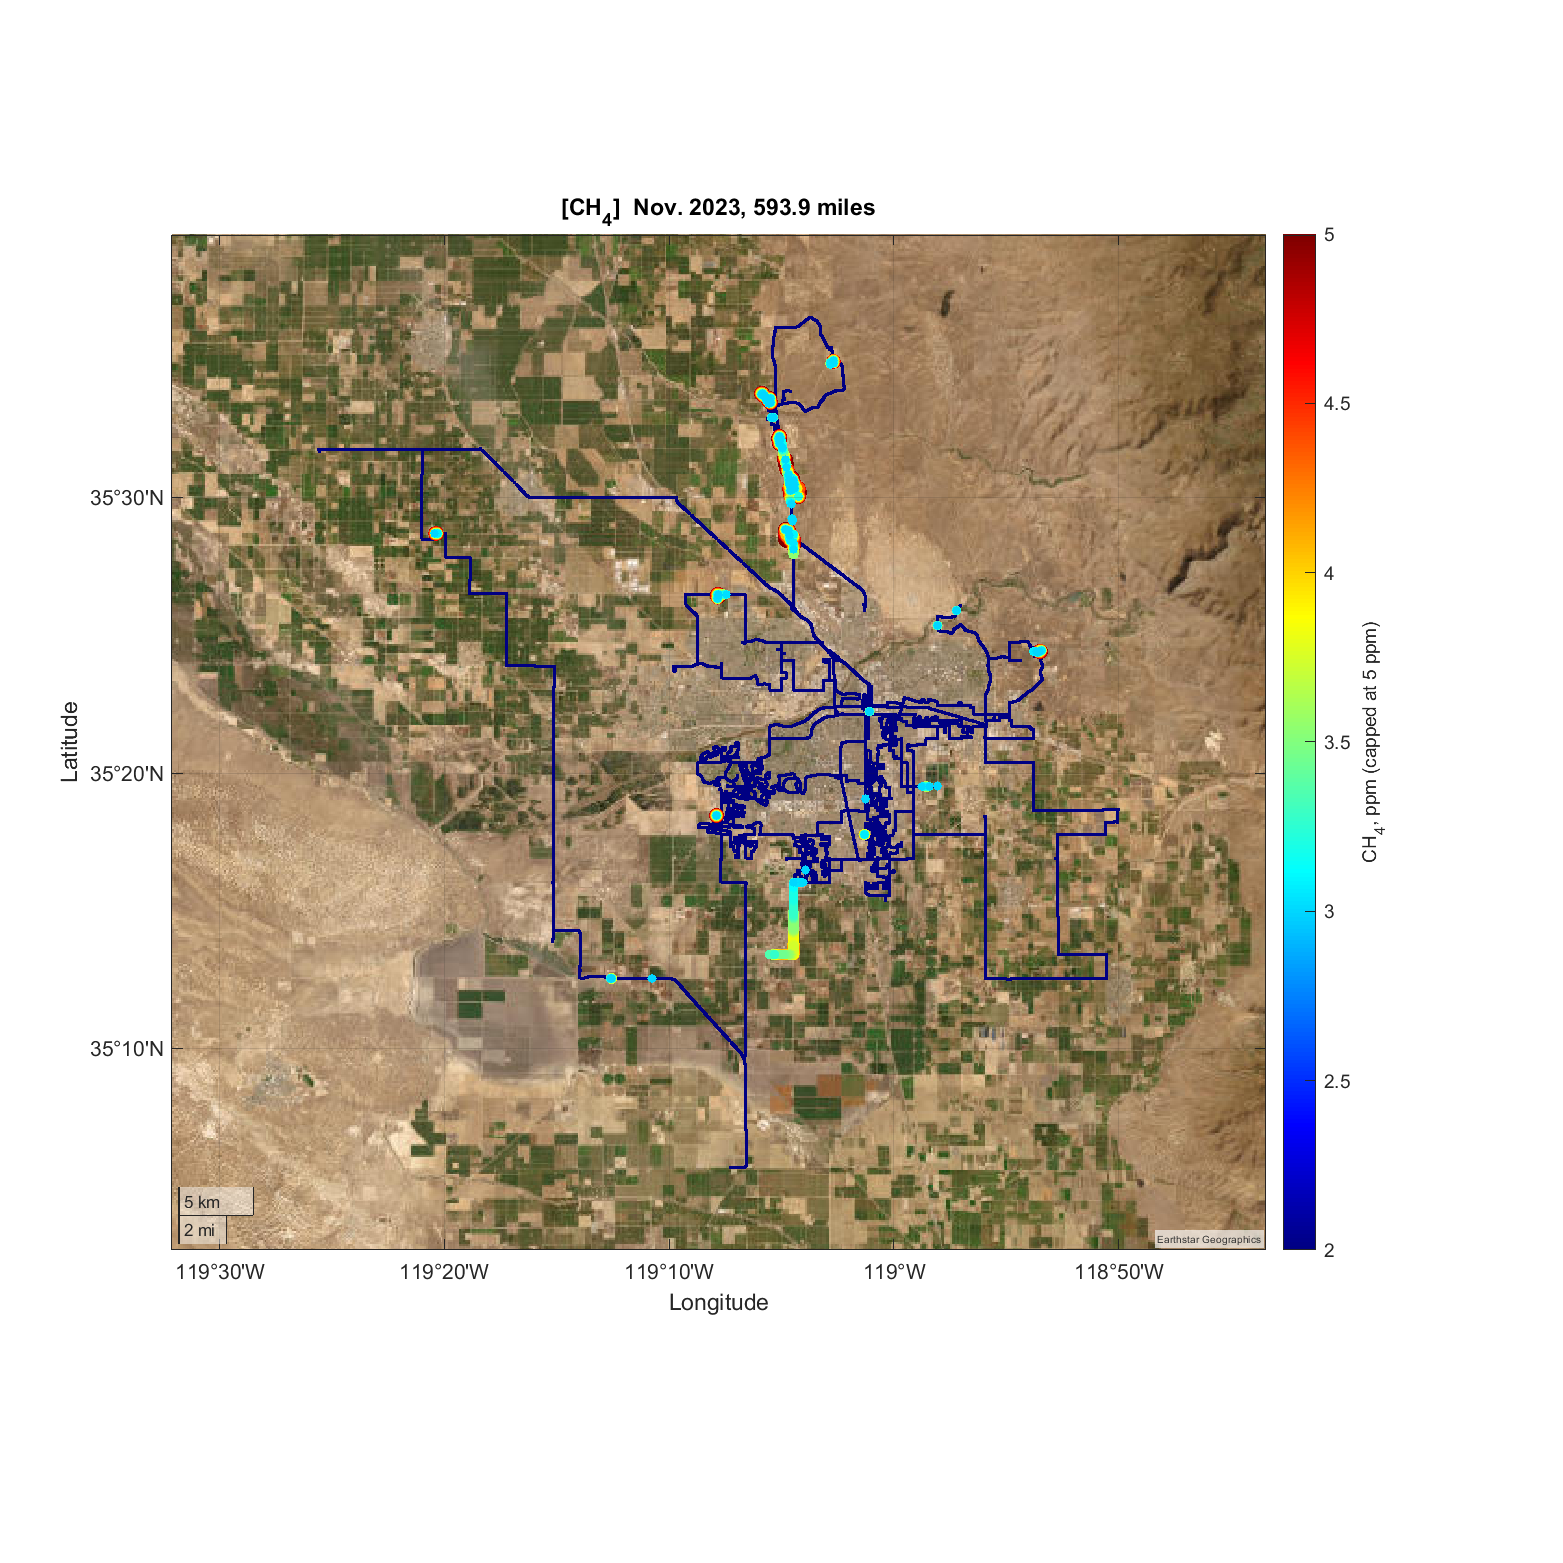
In March 2025, we partnered with Golden Empire Transit (GET-bus) to instrument an on-demand, paratransit bus with a methane/ethane analyzer and GPS, to map and characterize methane sources. The bus travels approximately 4000 km per month within Bakersfield City limits, as well as adjacent unincorporated areas.
Around 3,435 miles of road in the Bakersfield metropolitan area were covered during the campaigns carried out to date using our mobile survey platforms. The spatial variability of methane concentrations recorded is represented on the Earth’s surface using the longitude and latitude of each measurement.
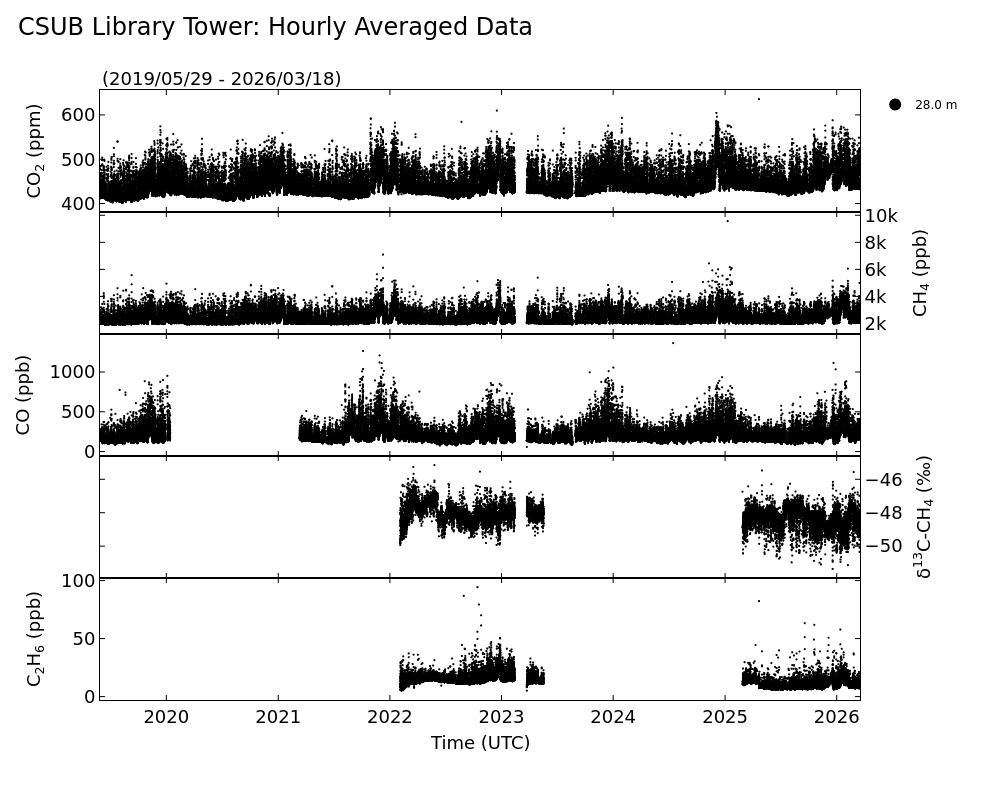
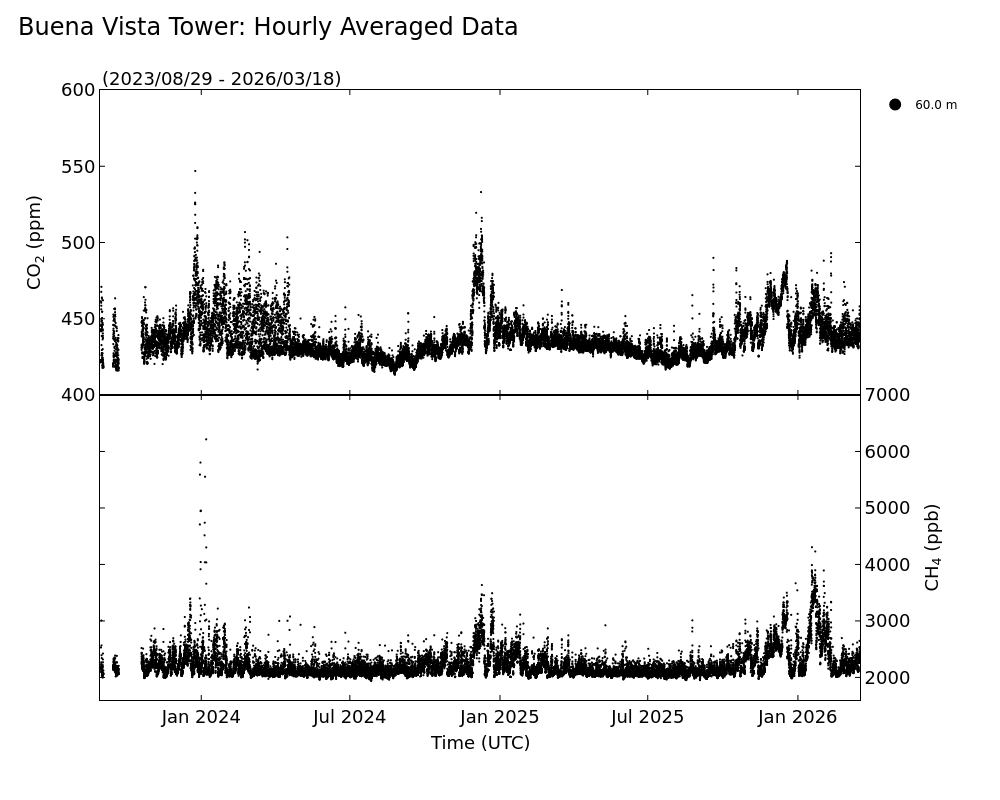
We are collecting continuous observations of methane, ethane concentrations, and methane isotopic ratio from tall towers to estimate regionally aggregated and spatially resolved (3-4 km grid) methane fluxes. This monitoring network will include four new sites on existing television or radio transmitter towers located in the Southern San Joaquin Valley.
We are surveying oil and gas facilities located in the Elk-Hills, Poso Creek, Kern Front and Kern River basin using an airborne platform equipped with methane monitoring sensors. These flights aim at surveying facilities previously identified as significant sources of methane as well as new sources.
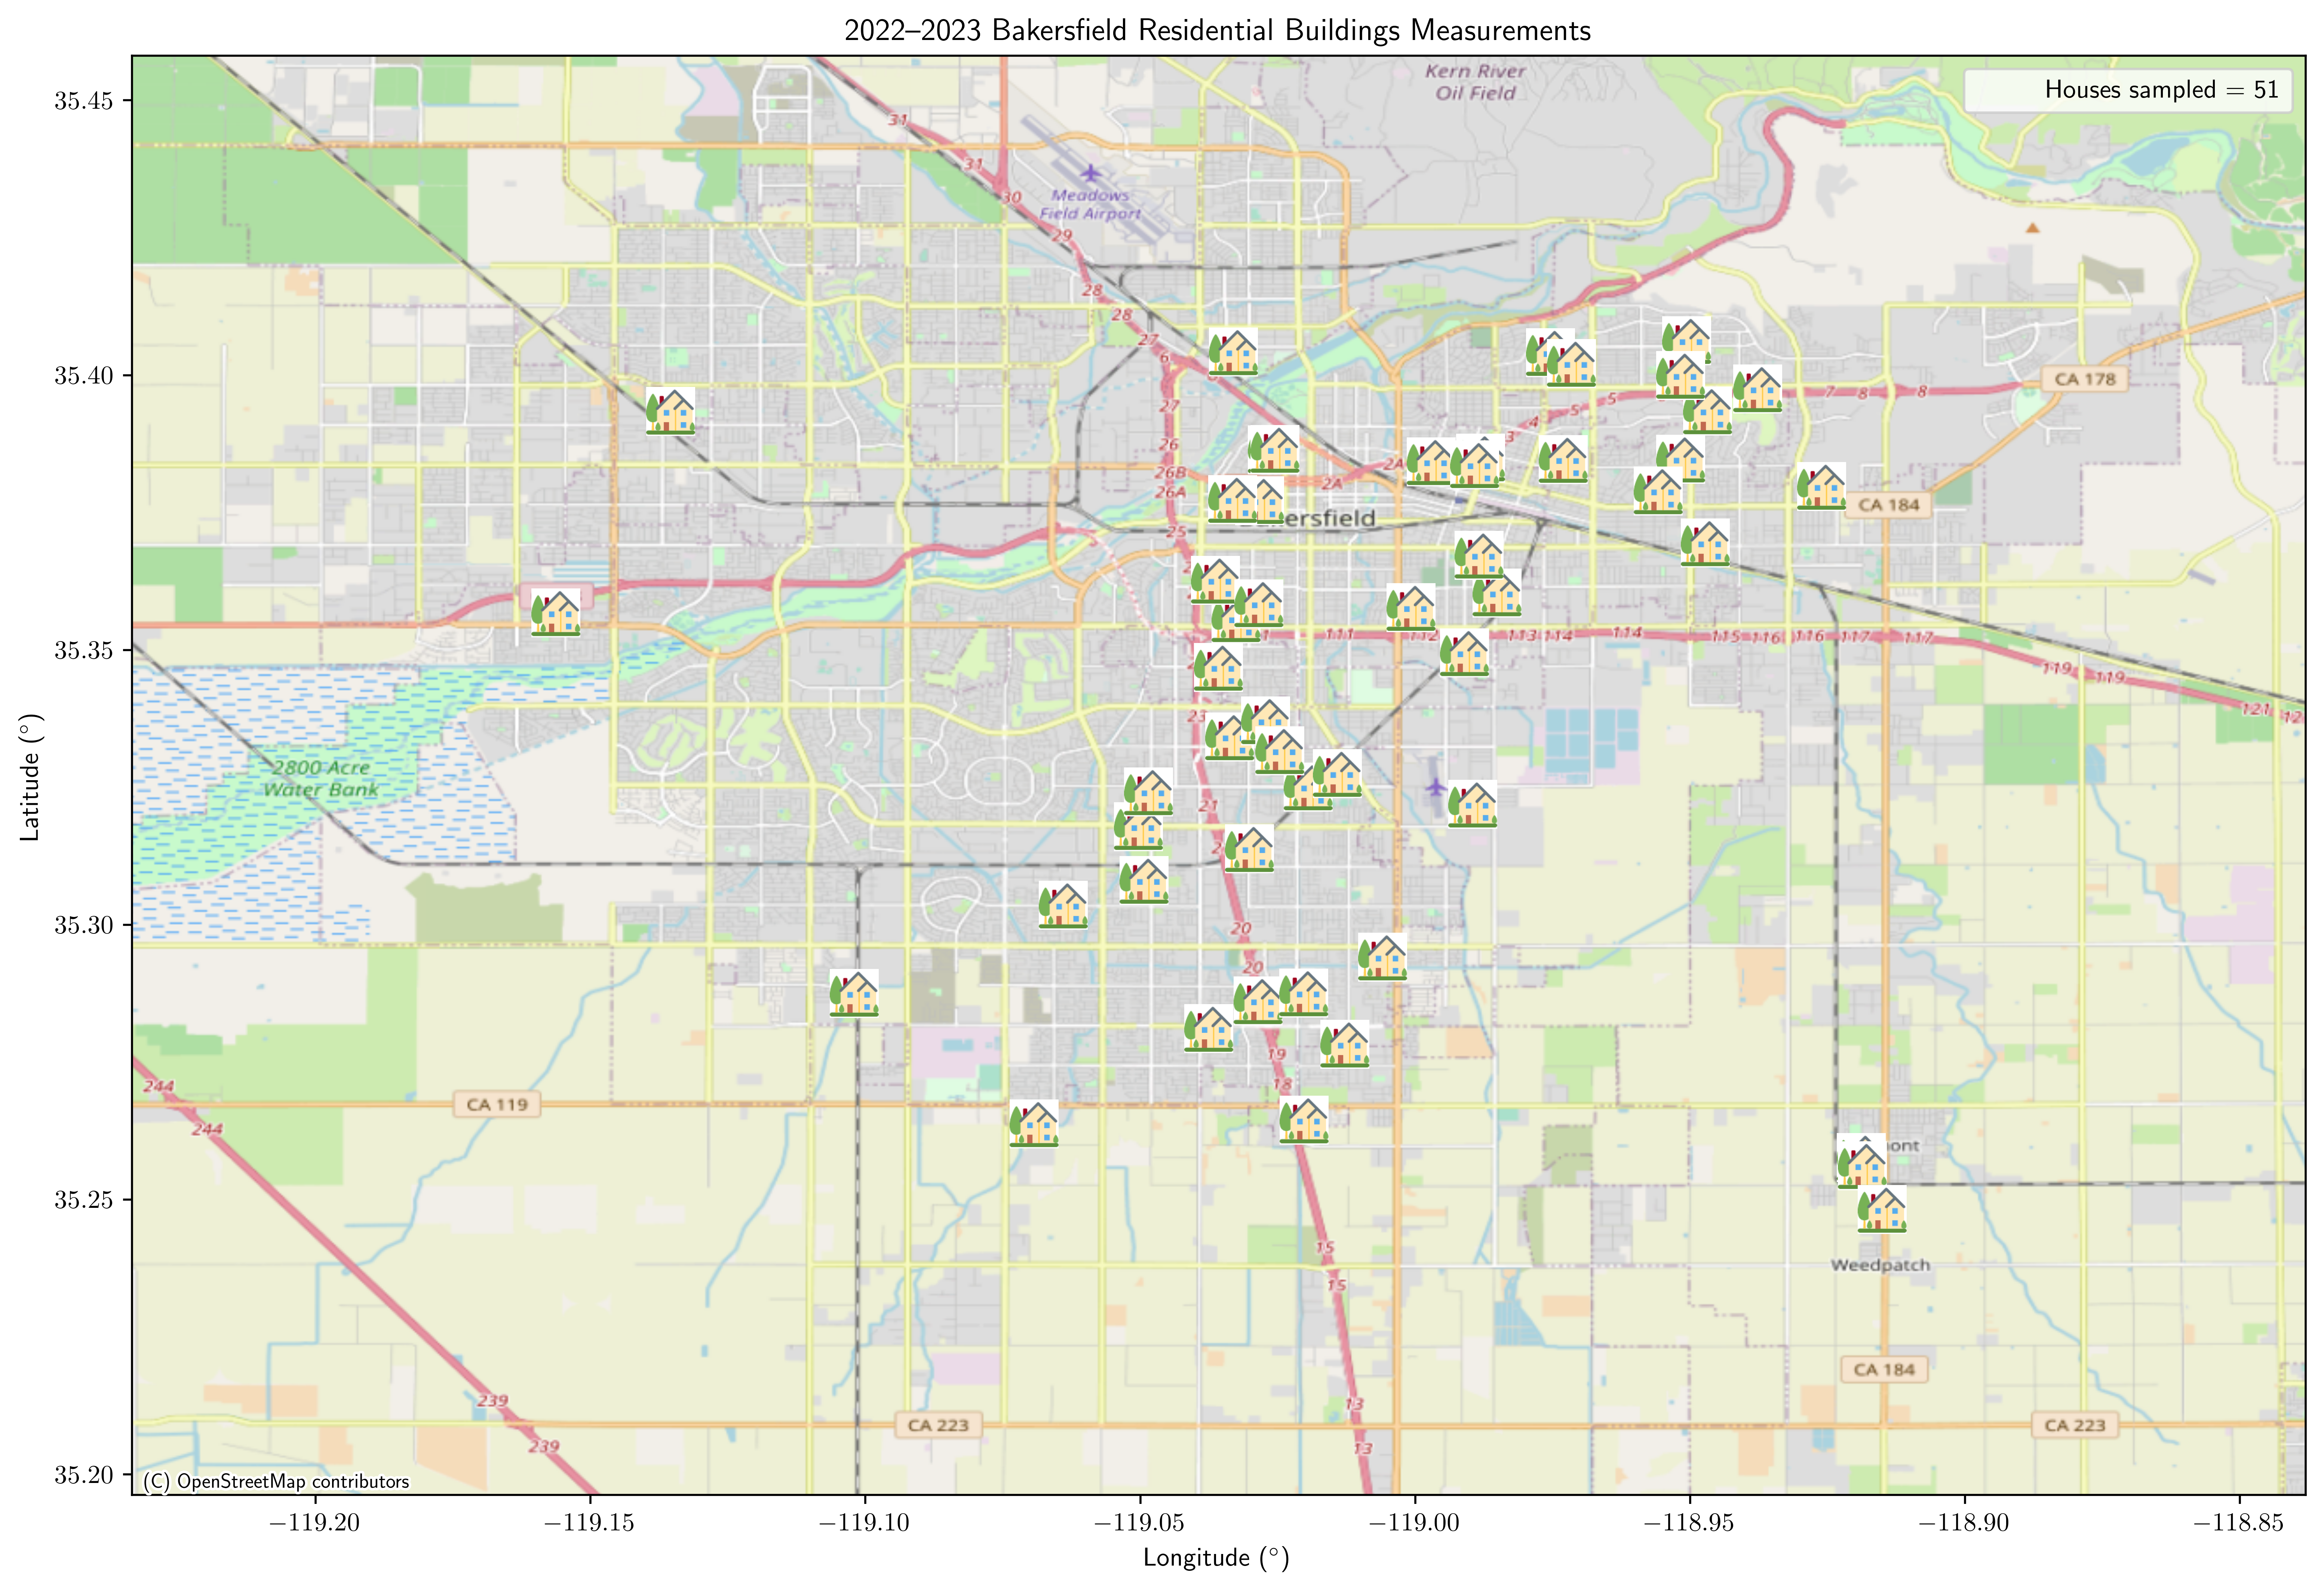
We are measuring post-meter emissions of leaking and uncombusted methane from water heaters, furnaces, and stoves in residential buildings located in the greater Bakersfield area, to quantify methane emissions after natural gas enters buildings.Measurements are performed using controlled dilution mass balance methods (e.g., Duct Blaster + Picarro G2210).

